Quality in the Age of AI
Insights
Span Research Team
In our dataset, larger PRs aren't just buggier in absolute terms. They're buggier per line. An individual line of code in a 1,000-line PR is more defect-prone than an individual line in a 50-line PR.
The relationship between PR size and defect rate is non-linear, and it survives normalizing for line count.
Span's Analysis
We ran a regression across 248,099 pull requests from a selected sample of engineering organizations, with defect attribution drawn from merged PRs linked to production incidents. The model included AI code ratio, PR size, complexity score, cycle time, and reviewer count. The outcome was whether a PR introduced a production defect. We examined defect rates both per-PR and on a per-line basis to test whether the size effect is purely a volume artifact.
Findings in this piece should be read as significant after controlling for PR size, complexity, cycle time, reviewer count, and AI code ratio. Two variables held up as significant predictors within that model: PR size and complexity. AI code ratio did not, once those were controlled for.
PR Size Is the Dominant Predictor
The effect is not subtle. Defect rate by PR size:
PR Size | Defect rate |
|---|---|
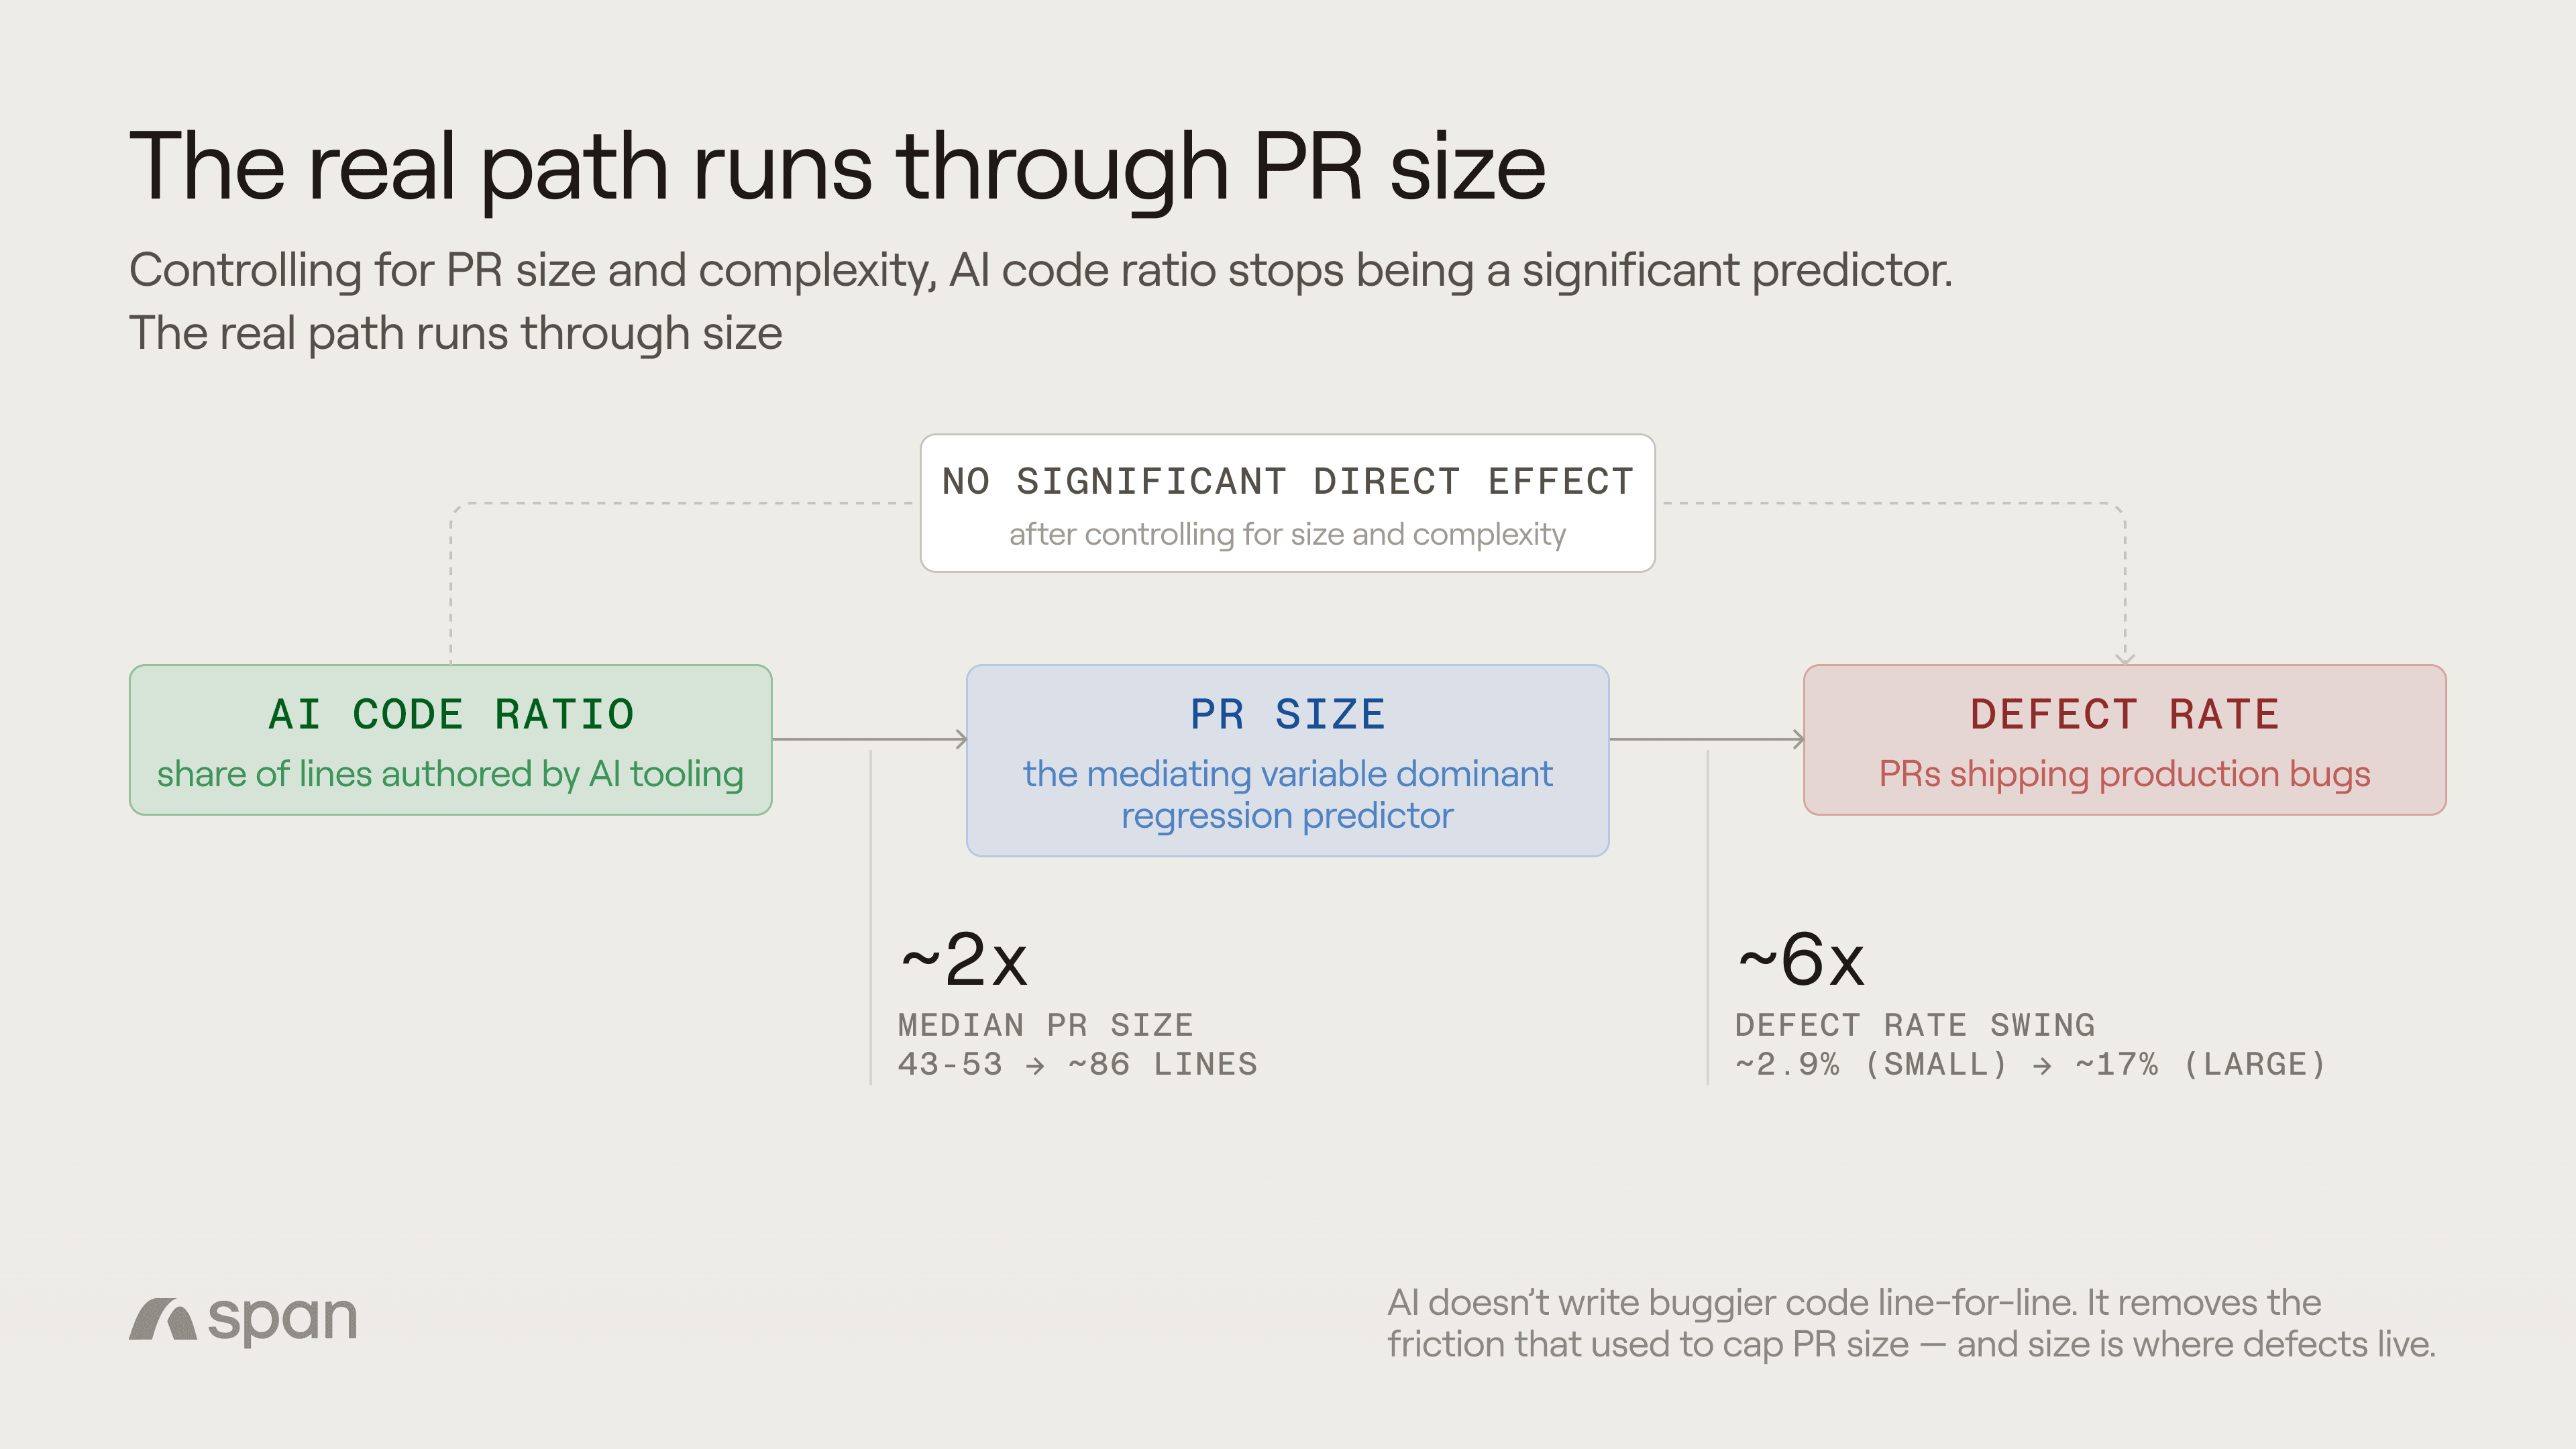
Small (tens of lines) | ~2.9% |
Large (1,000+ lines) | ~17% |
XL PRs introduce defects at 5.9x the rate of XS PRs. The directional finding here is not new — software engineering research has documented the relationship between change size and defect rate for decades, across languages, frameworks, and team structures. What our data adds isn't the existence of the curve. It's the shape, the steepness, and the cross-organizational stability and, more importantly for the AI question, where on that curve different kinds of work tend to land.
The more interesting result sits underneath the per-PR figure.
When we normalize by line count, the relationship doesn't flatten. Larger PRs have a higher defect rate per line, not just more defects in absolute terms. A line embedded in a 1,000-line change has a higher probability of being defective than the same line in a 50-line change. Whatever causes the size penalty isn't a volume effect. It's a property of how individual lines get treated as the surrounding change grows.
This pattern holds across every organization in the dataset, regardless of AI adoption level. Some orgs absorb large PRs better than others, likely through stronger testing or review discipline. But within any given org, larger PRs are reliably buggier per line.
What AI Does
This is where the story turns.
AI-assisted PRs (above 5%) are materially larger than mostly human-written ones (0-5%):
Median PR lines | |
|---|---|
Mostly human-written PRs | 43-53 |
AI-assisted PRs | ~86 |
AI-assisted PRs are roughly double the size. And given the non-linear per-line penalty, doubling median PR size doesn't double the risk. It pushes the median PR into a part of the size curve where per-line risk is meaningfully higher.
That's enough to explain the entire raw correlation between AI and defects, with no need to invoke direct AI quality effects. AI didn't create the size-defect relationship. It exists in the data with or without AI in the picture. What AI did was systematically shift the distribution of work into the part of the curve where the relationship bites hardest.
The arrow runs AI → PR size → per-line defect risk → defects, not AI → defects directly. Controlling for PR size, AI's independent contribution to defect rate is statistically insignificant.
This reframes the entire AI quality debate. The question "does AI write buggier code?" presumes a direct effect that the data doesn't support. The better question is: "does AI change the shape of the work in ways that make defects more likely?" And the answer is yes, through size.
Why This Finding Makes Sense
The per-line finding is the part that needs explanation. Why would an individual line of code be riskier when surrounded by more code?
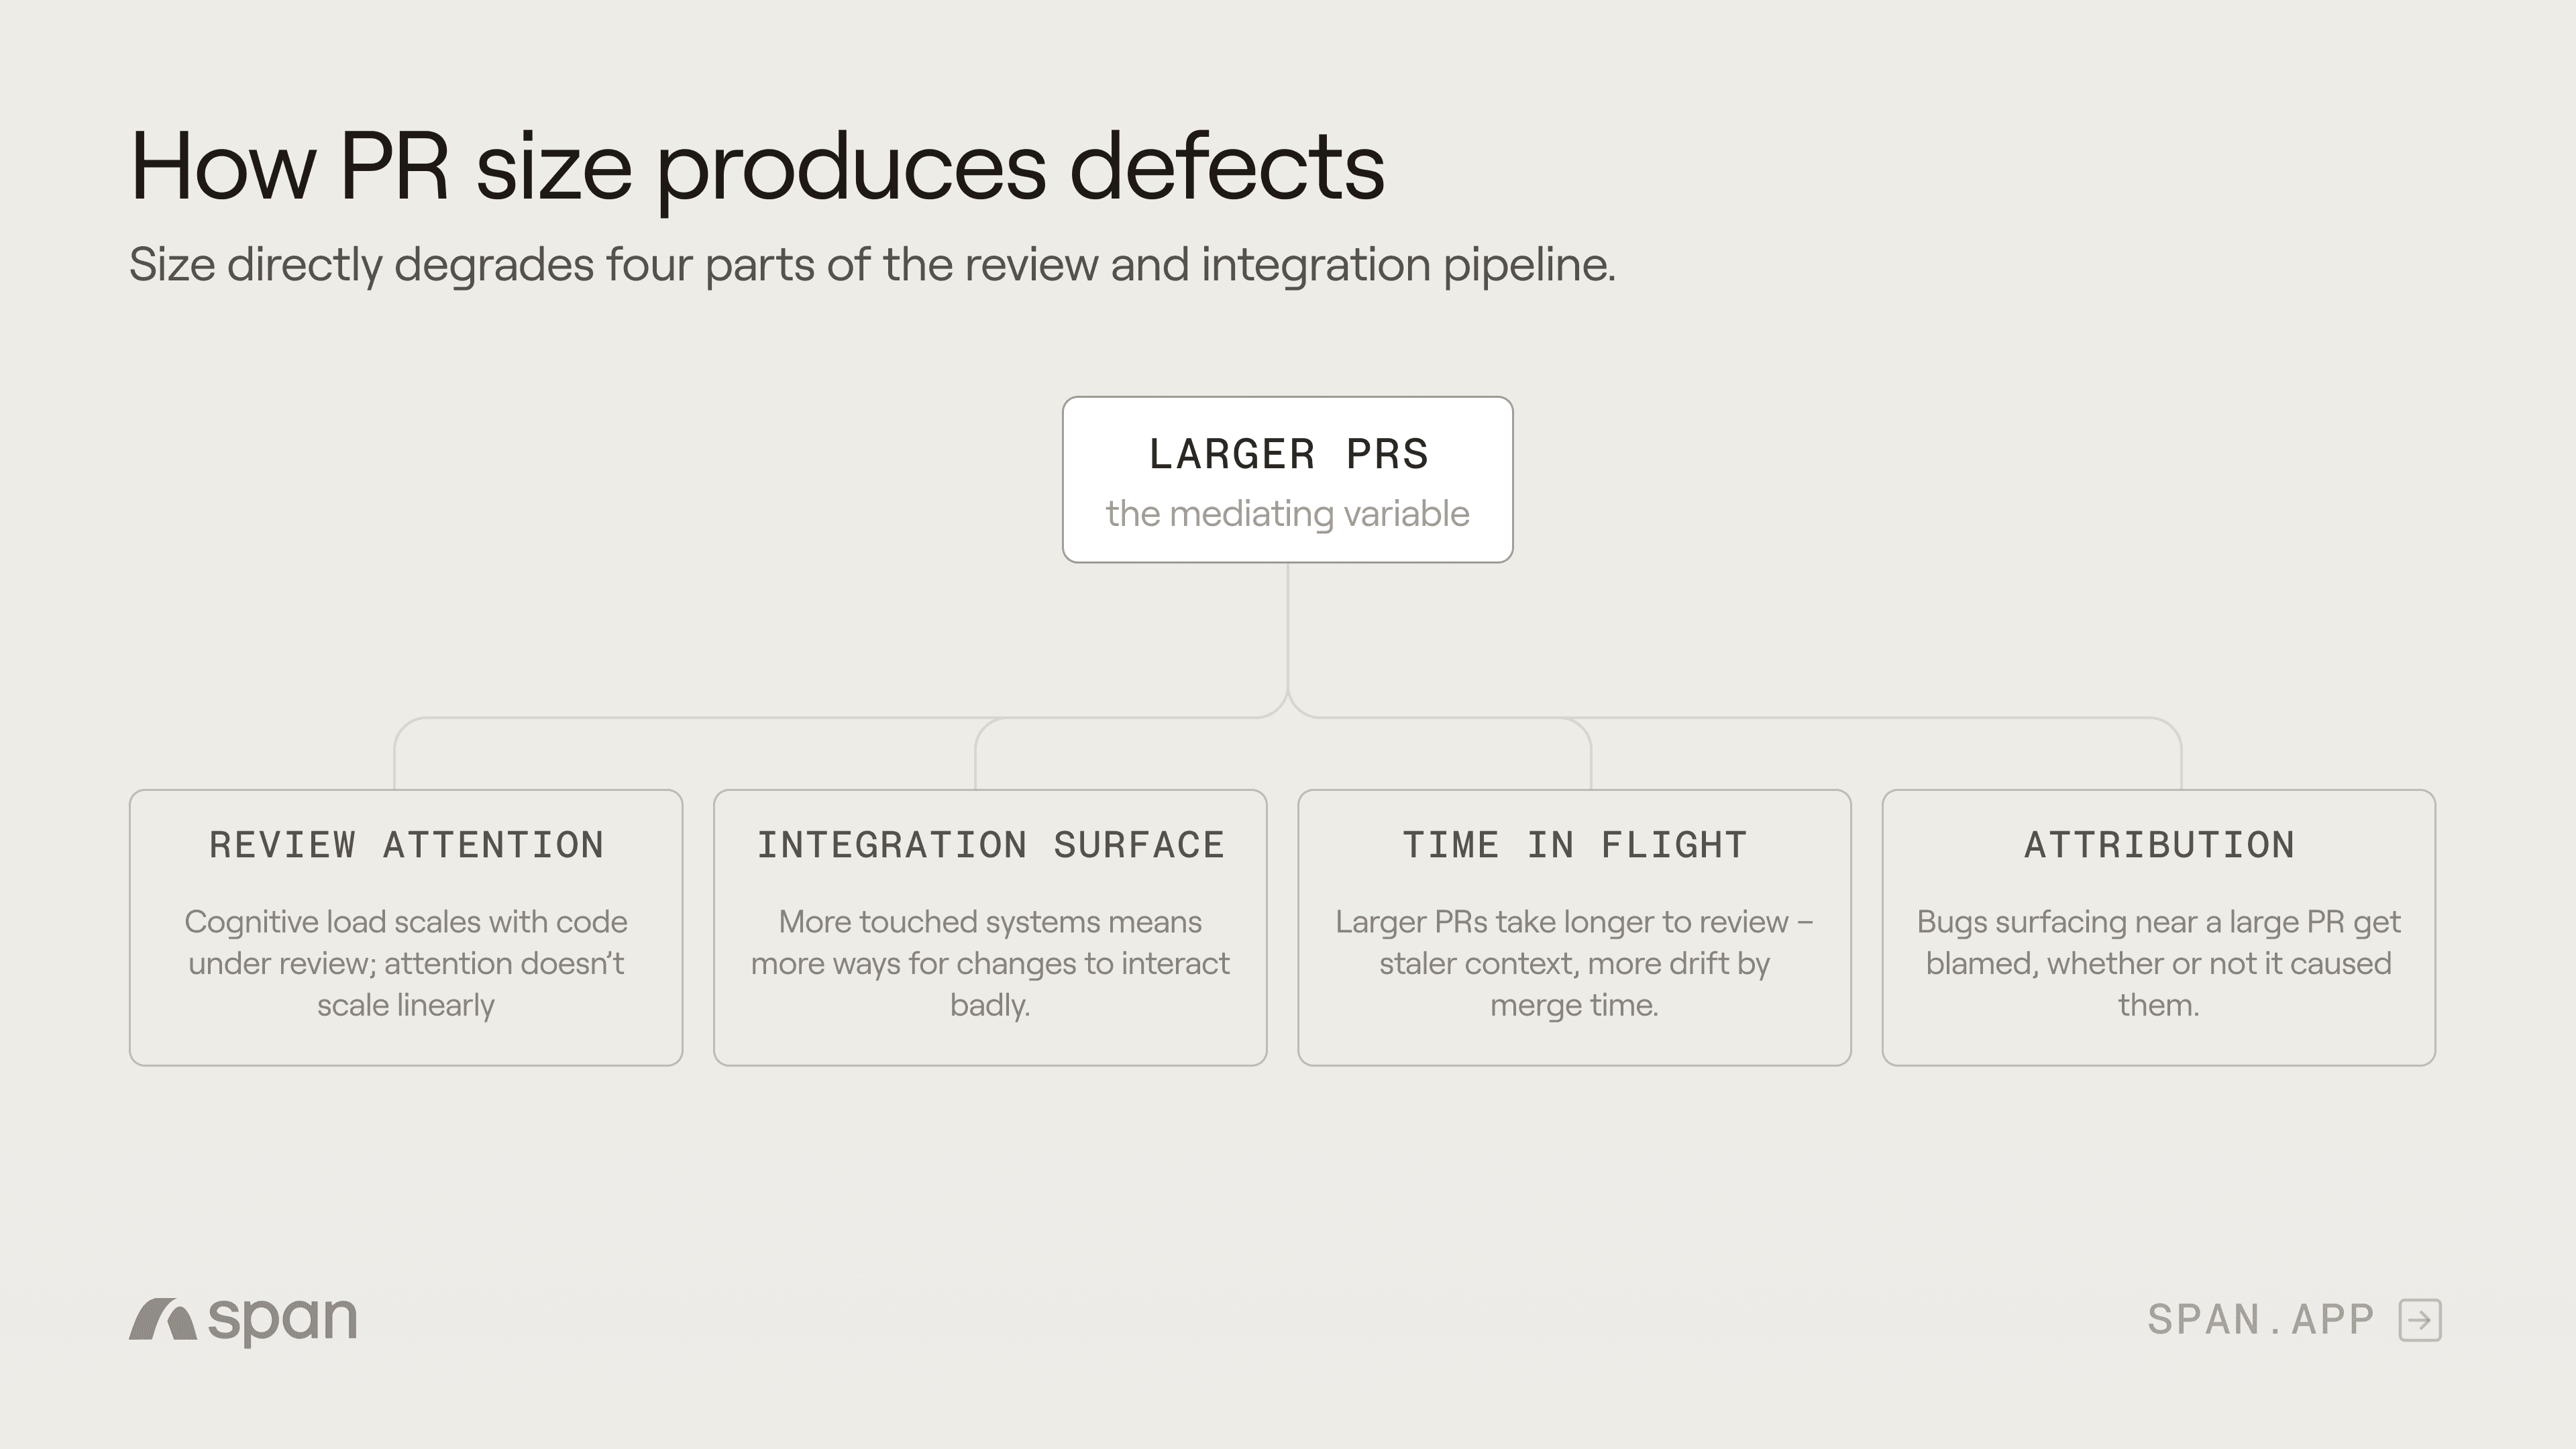
Four mechanisms, each operating at the line level:
Reviewer attention doesn't scale with PR size. Cognitive budgets are roughly fixed per review session. A reviewer giving a 50-line PR ten minutes spends about twelve seconds per line. A reviewer giving a 500-line PR the same ten minutes spends about a second per line. The 200th line of a 200-line PR gets less scrutiny than the 50th line of a 50-line PR.
Integration surface doesn't grow linearly. A line that touches a function in a 50-line PR sits inside a small, comprehensible context. The same line in a 500-line PR may interact with other modifications elsewhere in the same change in ways neither author nor reviewer fully traces. The probability that any given line interacts badly with the rest of the change scales faster than the line count.
Time-in-flight increases per-line drift. Larger PRs take longer to merge. The longer a line of code sits unmerged, the more likely it is that the surrounding system has changed underneath it — invalidating assumptions the line was written against, even if the line itself was correct when written.
Attribution blurs at scale. When a defect surfaces from a large PR, identifying which specific line introduced it is harder. This degrades the feedback loop that would normally let teams learn from individual defects, and the lines that did introduce problems get less corrective signal in the future.
None of these mechanisms require AI to operate. They're properties of how humans review, integrate, and reason about code. AI doesn't break them. It just pushes more work into the regime where they bind.
Connecting to the Wider Cohort
The cohort analysis showed AI Champions and AI Risk Zone teams running similar AI adoption levels but different defect rates, with PR size as one of three structural differentiators (see: Autonomous Teams Ship Cleaner AI Code). At the median, Champions ran ~86 lines and Risk Zone ran ~91 — a five-line gap that looked too small to matter.
The non-linearity explains why it does. At the part of the curve where both cohorts sit, even a five-line median shift represents a meaningful difference in per-line risk. Small differences in median PR size translate into outsized differences in defect rate when the underlying curve is steep.
The cohort piece described what disciplined teams do. This piece explains why the discipline produces the outcomes it does.
Recommendations
The implications for engineering leaders are real but not simple. Each decision is part of a bigger operational picture that entails determining what actions disciplined teams take, how they set thresholds that survive contact with engineering reality, and what the structural difference looks like with AI-effective teams.
This is the subject of our upcoming quarterly report. In this wider report, we'll present a full set of practices that draw on the findings in this piece with extended cohort-level analysis.
A Note on Scope
The regression identifies correlation with controls, not causation. PR size could be a proxy for unmeasured variables like task type, author seniority, system area. The mediation story is the most parsimonious explanation, and the directional stability across organizations supports it, but a single org's data could look different.
The per-line finding is the load-bearing methodological claim in this piece, and it should be read carefully: the relationship between PR size and defect rate is non-linear and survives line-count normalization across the sample. We're not claiming a controlled experiment in which the same code was reviewed under different PR-size conditions. We're claiming that across a large sample, the per-line defect rate increases with the size of the PR in which the lines are embedded, in a pattern that holds across organizations.
"AI code ratio" in our analysis is measured by IDE and editor telemetry. It captures lines attributed to AI tooling at the moment of authorship, not the quality of how that code was prompted, reviewed, or edited before commit. A PR marked 40% AI-generated could have been substantially refined; one marked 5% could have been AI-suggested end-to-end and mostly deleted. The telemetry gives us a useful signal, not a clean experimental variable.
The Bottom Line
PR size is a quality variable with mechanical properties of its own. The relationship to defects is non-linear and applies per line, not just per PR. Reviewer attention, integration surface, time-in-flight, and attribution all degrade as size grows, and they degrade in ways that affect each individual line of code, not just the change in aggregate. This is true with or without AI in the picture.
If you're measuring AI's impact on your engineering org by looking at defect rates alone, you're measuring a derivative of the thing that actually matters. Watch the lines.
Analysis based on 248,099 pull requests across a selected sample of engineering organizations, with defect attribution drawn from merged PRs linked to production incidents. Multivariate regression controlled for PR size, complexity score, cycle time, reviewer count, and AI code ratio. Defect rates examined both per-PR and on a per-line basis. Directional findings validated across organizations in the sample.